The Baseline: What TxDOT Tracks and How
The Texas Department of Transportation publishes an annual crash statistics report disaggregating every recorded collision by roadway type, county, time of day, restraint use, and contributing factors. The motorcycle-specific tables within that report are among the most granular of any state-level dataset in the country, covering fatalities, suspected serious injuries, and total crashes separately — a distinction that matters when evaluating where severity, not just frequency, concentrates.
The most recently published full-year report covers calendar year 2023. That year, Texas recorded 562 motorcycle fatalities, continuing a trend that has kept the annual death toll above 500 for most of the preceding decade. Total motorcycle crashes numbered approximately 7,600, meaning fatal outcomes occurred in roughly one of every thirteen recorded incidents — a severity ratio substantially worse than for passenger vehicles, consistent with what NHTSA's exposure data shows at the federal level about the per-mile fatality rate for motorcyclists relative to car occupants ↗.

TxDOT's data further disaggregates by roadway functional classification: interstate, US highway, state highway, Farm-to-Market road, and local street. That classification schema is what makes urban-rural comparison tractable. Interstate miles are overwhelmingly urban in Texas; Farm-to-Market roads are by definition rural, connecting agricultural areas to market towns under a TxDOT-administered designation separate from US and state routes. When the crash data is read against those classifications, a clear pattern emerges.
Where the Fatalities Concentrate
Urban crashes — defined by TxDOT as crashes within a metropolitan statistical area, on roads carrying city traffic — account for the majority of total motorcycle crashes by raw count. This is not surprising. Houston, Dallas-Fort Worth, San Antonio, and Austin together contain the majority of registered motorcycles in Texas and generate proportionally high exposure hours. In 2023, urban roadways accounted for approximately 60 percent of total recorded motorcycle crashes statewide.
Fatalities, however, distribute differently. Rural roads — Farm-to-Market routes, US highways in rural counties, and state highways outside metro areas — accounted for a disproportionate share of fatal outcomes relative to their share of total crashes. In the 2023 data, rural roadways generated roughly 52 percent of motorcycle fatalities while accounting for a substantially smaller share of total crashes. That inversion — fewer crashes, more deaths — is the statistical signature of high-speed rural road risk: less traffic density means fewer low-speed collisions, but when crashes do occur on undivided two-lane roads at open-range speeds, survivability drops sharply.
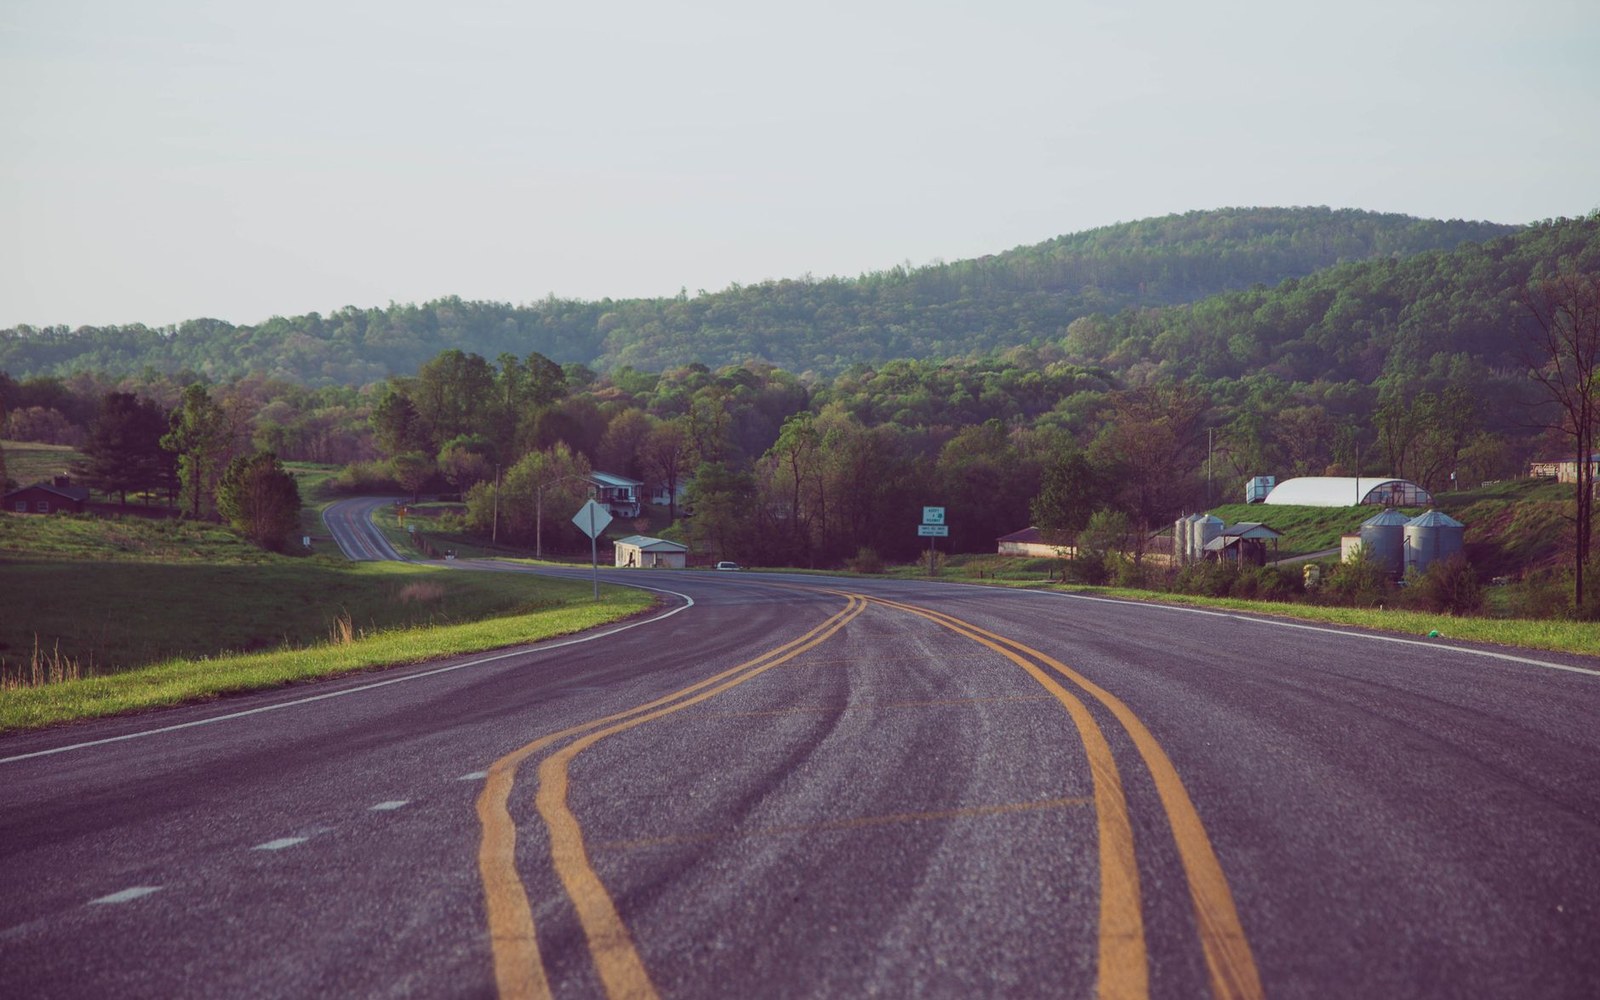
Farm-to-Market roads specifically appear repeatedly in the county-level tables for Real County, Kerr County, and surrounding Hill Country jurisdictions. These are the roads — Ranch Roads 335, 336, and 337 among them — that carry recreational motorcycle traffic in volumes the surrounding population does not otherwise generate. The Twisted Sisters corridor concentrates weekend riders on narrow curves with limited emergency-service access, and TxDOT's county crash tables reflect that concentration: Real County and Kerr County both show fatality-to-crash ratios well above the state average for motorcycle incidents, driven almost entirely by non-resident recreational traffic.
The trans-Pecos corridor along Farm-to-Market Road 170 presents a related but distinct profile. Crash totals are lower — the road carries far less volume than the Hill Country routes — but the remoteness factor is more severe. Presidio County, through which FM 170 runs toward Big Bend National Park, records motorcycle fatalities in years when total crashes number only in single digits, which speaks to both the lethality of incidents in that terrain and the response-time constraints that follow any crash in that corridor.
The Trend Line
Reading TxDOT's consecutive annual reports from 2018 through 2023 produces a trend line with two distinct phases. From 2018 to 2020, motorcycle fatalities in Texas tracked broadly flat, hovering between 482 and 519 per year. The 2020 figure — 519 — was recorded despite a significant reduction in overall vehicle miles traveled caused by pandemic-related restrictions, a pattern TxDOT's own analysis noted in its 2020 report: lower total traffic volume did not produce lower motorcycle fatality counts, partly because riders who did take to roads encountered less congestion and higher average speeds.
Fatalities rose in 2021 to approximately 544, then to 556 in 2022, before the 2023 figure of 562 extended what is now a three-year upward trend. The aggregate increase from the 2018 baseline to 2023 is roughly 14 percent, a period during which Texas registered motorcycle counts also grew — but not at a rate that fully accounts for the fatality increase on a per-registration basis. TxDOT's 2022 and 2023 reports both note speeding and failure-to-yield as the leading contributing factors, with alcohol involvement cited in approximately 30 percent of fatal motorcycle crashes — a proportion that has remained stable across the five-year window, suggesting it is a structural feature of the fatality profile rather than a year-to-year fluctuation.
The helmet-use column in TxDOT's fatality tables shows that the majority of riders killed in Texas were not wearing helmets at the time of the crash. Following the 1997 partial repeal of the state's universal helmet law — which removed the requirement for riders over 21 who carry qualifying insurance or have completed an approved safety course — helmet non-use among fatally injured riders has consistently exceeded 50 percent in TxDOT's annual figures. The 2023 data shows the non-helmeted share of motorcycle fatalities at approximately 57 percent, a figure that tracks closely with the patterns documented in TxDOT's own published crash data summaries.
Reading the Map
The county-by-county tables in TxDOT's crash report function as a rough risk geography for the state. The ten counties with the highest absolute motorcycle fatality counts in 2023 are all urban — Harris, Bexar, Dallas, Tarrant, and Travis counties account for a large portion of total deaths simply by virtue of population and registration density. But the counties with the highest fatality-to-crash ratios — the places where crashes are most likely to be fatal — cluster in two geographic bands: the Hill Country counties west and northwest of San Antonio, and the trans-Pecos and Big Bend counties in far West Texas.
That geographic split carries an implication for how the state's motorcycle risk should be understood. The urban fatality problem is primarily one of volume: millions of miles ridden annually in dense, congested environments where intersection conflicts and lane changes generate crashes. The rural fatality problem is one of severity and access: fewer crashes, but a higher proportion of them are unsurvivable given road geometry, speed, and the distance from trauma care. TxDOT's data does not resolve which problem is more tractable, but it does show, with unusual clarity, that they are different problems requiring different analytical frames — and that both are present, at scale, every year in Texas.